Inside the Galaxy physics lab, and the replay of your network growing
The Galaxy is a force simulation. The physics lab hands you its controls: what each slider does, the Clusters preset, colour by, find, and a replay of your network by the day you connected that you can save as a video.
3 min readBy Blake Burford
The Galaxy is the first thing Six Degrees shows you: you in the middle, your connections on rings around you, the ones who can open the most doors closest in. It's drawn by a force simulation, the same idea behind graph views in tools like Obsidian: every dot pushes the others away, lines pull connected dots together, and the picture settles where the forces balance.
The physics lab hands you the controls. It's experimental, and it lives in the Galaxy's Filters panel: tick Physics lab to open it.
The forces
Five sliders set how the Galaxy lays itself out:
Gravity (0 to 3): a pull in towards you. At 0, nothing draws the network to the centre but its own lines.
Rings (0 to 5×): how hard each tier holds its ring. At the default, S sits nearest and D furthest out. At 0 the rings let go, and the Galaxy finds its own shape.
Push (0 to 300): how hard dots push each other apart.
Pull (0 to 15×): how hard each person pulls the people who came through them, the circle a scan found behind them.
Distance (0.05 to 6×): how far out those people sit.
Two more set the look: dot size and line thickness. Dots can be sized by power score or by how many people hang off them, and names can show for the S tier and catalysts only, or for all your connections. A Names switch in Filters turns them off altogether.
Everything moves the Galaxy in place, and Reset puts today's layout back.
Clusters
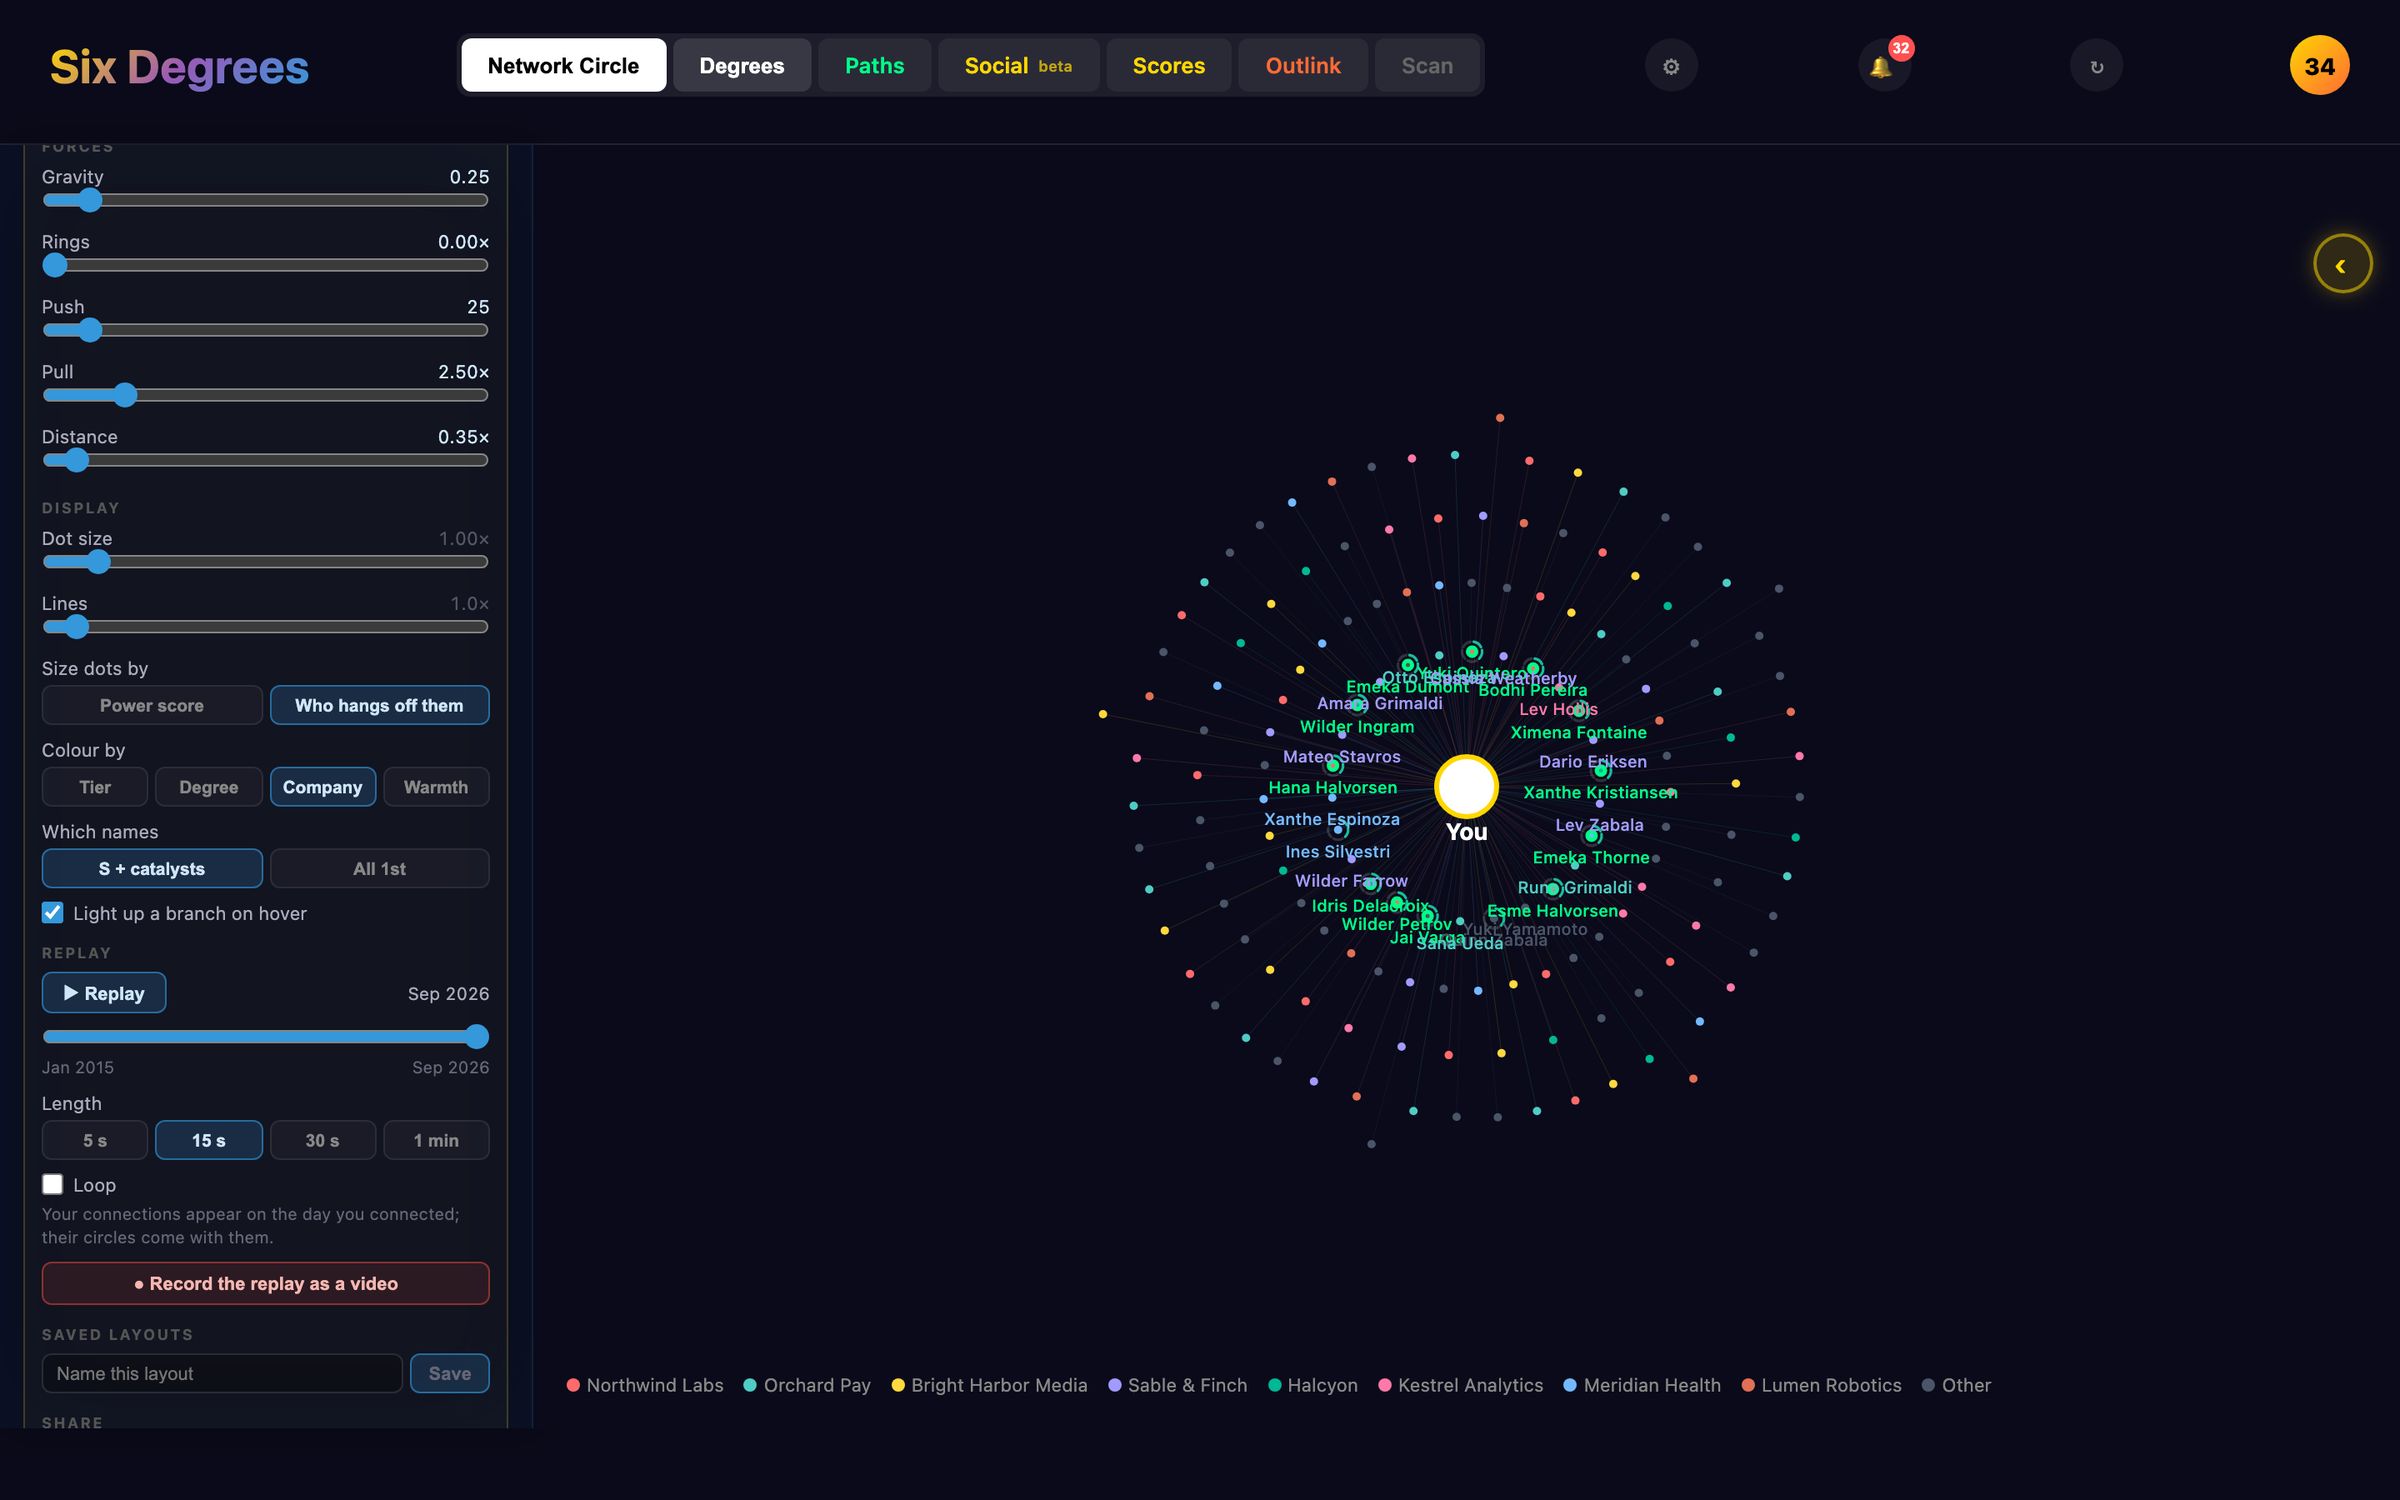
The Clusters preset is the fastest way to see the lab do something: it lets the rings go (rings 0), adds a little gravity (0.25), more push (25), a strong pull (2.5) and a short distance (0.35), and sizes dots by how many hang off them. Each connection gathers their own circle round them, and your network turns from rings into neighbourhoods.
Hovering a dot lights up its branch: everyone behind it, and the chain back to you. The rest dims.
Clusters, coloured by company, on the invented sample network.
Colour, find and names
Colour by repaints the Galaxy four ways, each with a legend:
Tier, the default, from S to D;
Degree: your connections, the people they know, and anyone further out;
Company: the eight most common companies in view, and everyone else in grey;
Warmth: from the experimental Social tab, how recently you've been in touch.
Find takes a name, a company or a role from two letters. Everyone who matches lights up and the rest dim; Enter flies to the best match and opens their card.
The replay
Replay plays your network growing. Each connection appears on the day you connected, and their circle arrives with them. There's a time slider, a length of 5 seconds, 15 (the default), 30 or a minute, and Loop. If you've used the Social tab, your job starts are marked along the timeline in gold and your posts in blue, and the job you were at shows as the replay passes each date.
The replay needs "connected on" dates, which come from a scan or from LinkedIn's own export. The invented sample network has none, so there's nothing to replay until you bring your own network in.
Saving it
Save a picture makes a PNG of the Galaxy at twice its size on screen, with its legend.
Record the replay saves it as a video: MP4 (H.264) where your computer's window supports it, otherwise WebM, at 12 frames a second. The button only appears where the window can record.
Saved layouts keep a set of slider settings under a name, so a layout you like is one click away.
Beside Save a picture, the lab reminds you that it shows real names, so check it before you post it. Nothing leaves your computer unless you share the file yourself.
Why a physics lab?
Because rings are a good first picture and a poor only picture. Letting the rings go shows who gathers people around them. Colouring by company shows where your network clusters. And the replay shows something no list can: how your network grew, and which chapters of your working life it came from.
Six Degrees keeps your network in one folder on your own computer. What that means in practice, what the app contacts and when, and the protections that come with running on localhost.
How the optional Six Degrees scanner paces itself, the daily and monthly budgets it keeps to, why it stops at the first push-back, and what the risk to your LinkedIn account really is.
How Six Degrees ranks everyone two steps away, counts every way in, and finds the people only one of your connections can reach, with the formulas, and the invented sample network as the example.
 Six Degrees
GitHub
Six Degrees
GitHub